The Missouri Department of Health and Senior Services (DHSS), Department of Natural Resources (DNR), and researchers at the University of Missouri – Columbia have been collaborating on a statewide project to test domestic wastewater for genetic markers of SARS-CoV-2, the virus that causes COVID-19. Missouri’s Coronavirus Sewershed Surveillance Project is funded by a Centers for Disease Control and Prevention Epidemiology and Laboratory Capacity grant, Environmental Public Health Tracking, and federal CARES funds.
Studies in the Netherlands, Italy, and United States found a direct correlation between the amount of SARS-CoV-2 genetic material in sewage and the number of reported cases within a given “sewer shed,” or the area that drains into a community’s wastewater collection system.
While the virus that causes COVID-19 is new, using wastewater for tracking disease is not. Wastewater testing has proven useful in tracking diseases such as polio and norovirus and is becoming a useful tool for SARS-CoV-2 surveillance. The SARS-CoV-2 virus particles are shed in human feces by many infected individuals, including those who are symptomatic and asymptomatic. These particles can be detected in wastewater by testing for specific genetic markers. Wastewater is not known to be a transmission pathway for the virus.
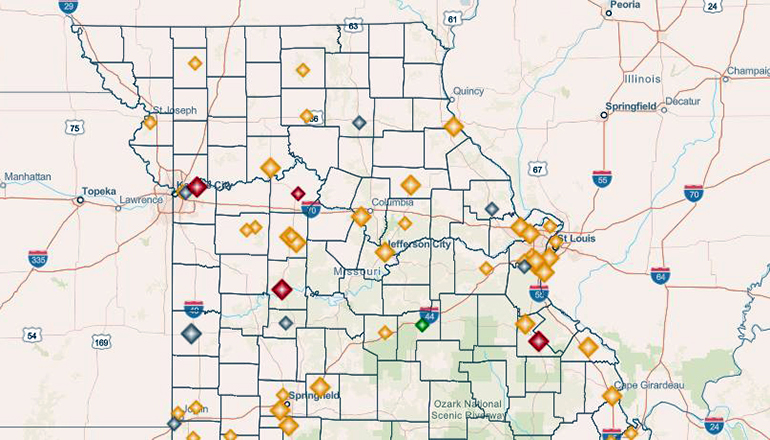
A map on the Department of Natural Resources website shows samples of wastewater are being received from sewer plants at Milan and Brookfield in the Green Hills area and nearby Albany and Macon. They are among 59 community wastewater facilities tested weekly with the total topping 2,000 samples as of this week.
The sewer shed surveillance project is currently testing 59 community wastewater facilities weekly and has tested more than 2,000 samples to date, generating enough data to provide meaningful statistics for interpretation. These findings currently indicate sewer shed testing best correlates with human case data with a 4 to 6-day lag, meaning this may be an early indication of increasing trends of COVID cases. The data also shows that a 40% increase in sewer shed viral load over a week, or two consecutive weeks of 25% increases or greater, is followed by at least a 25% increase in measured human cases about 70% of the time. This level of agreement is evident even given the variability across sewer heds in wastewater flow rates, chemical matrices, industrial activities, population changes, rates of human COVID-19 testing, and other factors.
The sewer shed surveillance team developed a story map to display these results. The storymap contains an interactive map displaying sewer shed trends and identifying those found to have a significant increase in the viral particles measured. The interactive map also identifies sewer sheds with little to no change in the trend but remain elevated.
Individuals can select specific sewer sheds and see their sample results. Because of the numerous variations from one sewer shed to another, it is not possible to directly compare sewer shed readings between facilities and communities. “As the outbreak continues, this program remains an effective tool for trends analysis to be used with other measures of viral spread in a monitored population,” said Jeff Wenzel, Bureau Chief of DHSS’s Bureau of Environmental Epidemiology.
For more information about the sewer shed surveillance project, contact the Department of Health and Senior Services Environmental Public Health Tracking Team at [email protected] or 866-628-9891 or 573-751-6102.


